How to Use Parabolic SAR in Forex Trading
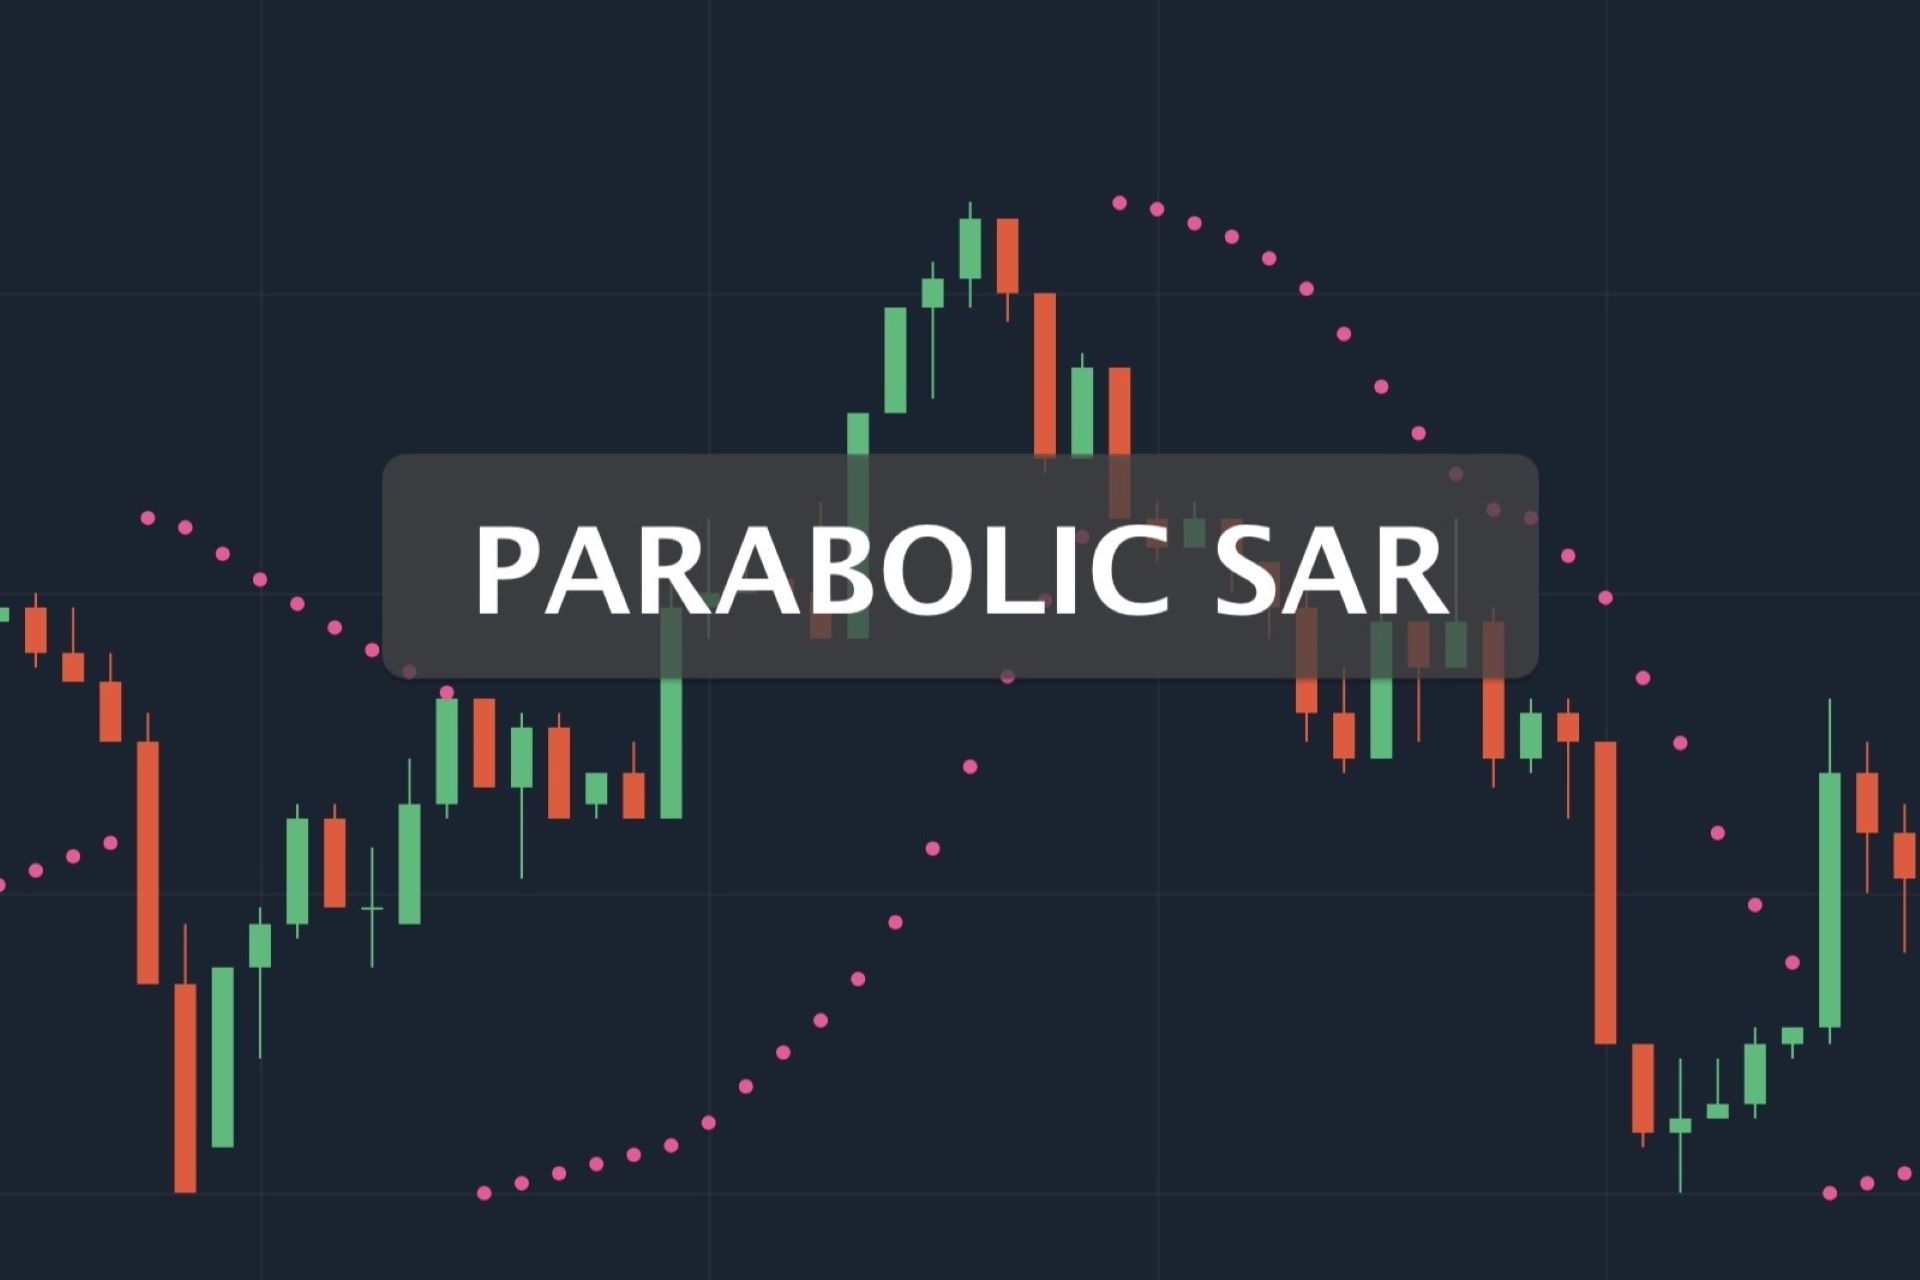
The Parabolic SAR (Stop and Reverse) is a technical analysis tool developed by J. Welles Wilder. It is used to identify potential reversals in market price direction and to set trailing stop losses. The indicator places dots above or below the price, depending on the trend direction. When the trend is upward, the dots are below the price, and when the trend is downward, the dots are above the price.
Setting Up Parabolic SAR
To use the Parabolic SAR effectively, it is important to understand how to set it up on your trading platform. Most modern trading platforms, such as MetaTrader 4 or 5, include the Parabolic SAR as a standard indicator. Setting it up typically involves just a few steps.
| Setting | Description | Default Value | Recommended Adjustment |
| Step | Determines sensitivity of the indicator. Higher values make it more sensitive to price changes. | 0.02 | Adjust based on market volatility and trading style. Higher for volatile markets, lower for stable markets. |
| Maximum | Defines the acceleration factor. Determines how quickly the SAR can accelerate in response to price movements. | 0.20 | Higher values can reduce sensitivity but may produce fewer signals. Lower values increase sensitivity but may result in more false signals. |
| Color | Specifies the color of the dots on the chart for easy visualization. | Green/Red | Customize based on personal preference or chart theme. |
| Symbol | Allows customization of the symbol used for the SAR dots on the chart. | Dot | Optional customization to differentiate from other indicators. |
Once the indicator is applied with your preferred settings, you will see a series of dots appear on your chart, either above or below the price. These dots will move closer to the price as the trend progresses, indicating potential points for placing stop-loss orders. Adjust the step and maximum values as needed based on your trading strategy and market conditions.
It is advisable to test different settings in a demo account before using them in live trading. This allows you to find the optimal configuration for your specific trading style and the currency pairs you are trading. Additionally, consider using the Parabolic SAR in conjunction with other indicators, such as moving averages or the Relative Strength Index (RSI), to confirm signals and improve accuracy.
Interpreting Parabolic SAR Signals
Interpreting the signals from the Parabolic SAR is straightforward but requires an understanding of its behavior in different market conditions. The basic principle is that when the dots switch from above the price to below the price, it signals a potential upward reversal. Conversely, when the dots move from below the price to above the price, it indicates a potential downward reversal.
Key points for interpreting parabolic SAR signals:
- Upward Reversal (Buy Signal): When the Parabolic SAR dots move from below the price to above the price, it suggests a potential end to a downtrend and the beginning of an uptrend. Traders may consider opening long positions or closing short positions.
- Downward Reversal (Sell Signal): When the Parabolic SAR dots switch from above the price to below the price, it indicates a potential end to an uptrend and the start of a downtrend. This signal can prompt traders to close long positions or open short positions.
- Trend Confirmation: The proximity of the Parabolic SAR dots to the price provides insights into the strength of the trend. Dots that are close to the price indicate a strong trend, while dots that are further away suggest a weaker trend.
- Consideration of False Signals: In choppy or sideways markets, the Parabolic SAR may produce frequent signals that can be misleading. It is important to confirm signals with other indicators or wait for additional price confirmation before taking action.
Understanding these key points helps traders utilize the Parabolic SAR effectively in Forex trading, enhancing decision-making and improving the accuracy of trade entries and exits.
Developing a Trading Strategy with Parabolic SAR
Creating a trading strategy using the Parabolic SAR involves combining it with other indicators and setting clear rules for entry, exit, and risk management. A well-defined strategy helps to maintain discipline and reduce emotional decision-making in trading.
Components of an effective trading strategy:
- Indicator Combination: Combine Parabolic SAR with other technical indicators such as moving averages, Relative Strength Index (RSI), or MACD (Moving Average Convergence Divergence) to confirm signals. This reduces the likelihood of false signals and enhances the reliability of trade setups.
- Entry Rules: Define specific criteria for entering trades based on Parabolic SAR signals and confirming indicators. For example, enter a long position when Parabolic SAR indicates an uptrend and RSI is above 50, indicating bullish momentum.
- Exit Rules: Establish clear rules for exiting trades to lock in profits or cut losses. Use trailing stop-loss orders based on Parabolic SAR movements to protect gains as the trend progresses. Consider taking profits when the Parabolic SAR begins to flatten or reverse its direction.
- Risk Management: Determine the position size based on your risk tolerance and account size. Use stop-loss orders effectively to limit potential losses in case the market moves against your position. Adjust position sizes as necessary based on the volatility of the currency pair and market conditions.
- Backtesting and Optimization: Test your trading strategy on historical data to evaluate its performance. Identify strengths and weaknesses and make adjustments to optimize the strategy for different market conditions. Use demo accounts for practice before implementing the strategy in live trading.
Developing a comprehensive trading strategy with the Parabolic SAR involves integrating these components to create a systematic approach to trading Forex. This approach not only enhances consistency but also improves the overall profitability and risk management of your trades.
Evaluating the Performance of Parabolic SAR
Evaluating the performance of the Parabolic SAR in your trading strategy involves analyzing historical trades and measuring key performance metrics. This process helps to understand the effectiveness of the indicator and make necessary adjustments to improve results.
Start by reviewing past trades where the Parabolic SAR was used to generate signals. Assess whether the trades were profitable and if the indicator accurately predicted trend reversals. Pay attention to instances where the Parabolic SAR produced false signals and analyze the market conditions that led to those errors.
Calculate the win rate, which is the percentage of profitable trades out of the total number of trades. A higher win rate indicates better performance, but it should be considered alongside other metrics such as the risk-to-reward ratio. The risk-to-reward ratio measures the potential profit of a trade relative to the potential loss, helping to ensure that the strategy is profitable over the long term.
Another important metric is the drawdown, which measures the largest peak-to-trough decline in your trading account. A high drawdown indicates significant losses and suggests that the strategy may be too risky. Monitoring drawdowns can help identify periods of poor performance and areas where risk management needs improvement.
Using a combination of performance metrics provides a comprehensive view of the Parabolic SAR’s effectiveness in your trading strategy. Regularly updating your analysis and incorporating new data ensures that the strategy remains relevant and adaptive to changing market conditions.